People walk past Ann and Robert H. Lurie Children’s Hospital of Chicago on Dec. 12, 2022. Illinois, a state that expanded Medicaid eligibility, saw improved insurance coverage and access to care in the potential Medicaid gap population. Photo: Joel Lerner/Xinhua via Getty Images
A key provision of the Affordable Care Act (ACA) was the requirement that states expand Medicaid eligibility to people with incomes up to 138 percent of the federal poverty level. After the Supreme Court ruled in 2012 that the penalty associated with this requirement was unconstitutionally severe, states could choose whether to adopt the reform. 1 Twenty-six states including the District of Columbia expanded Medicaid initially, and 15 others followed suit. As of September 2023, 10 states have not expanded eligibility. 2
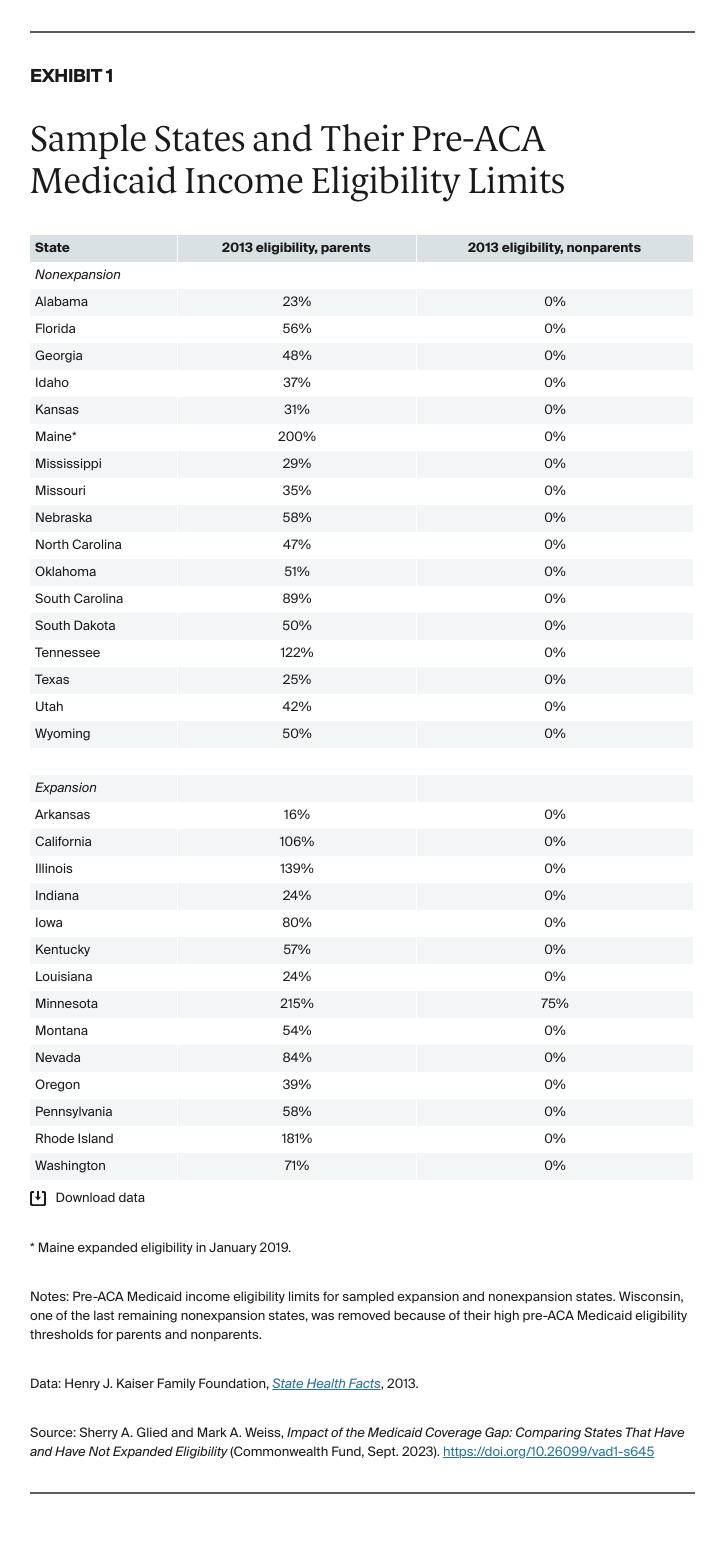
The effects of expansion varied because, prior to the ACA, states could set their own Medicaid income eligibility thresholds for nondisabled adults who were not pregnant. They also could vary these thresholds by population, typically setting different eligibility thresholds for parents and nonparents (Exhibit 1). 3 As well as establishing a standard national income eligibility threshold of 138 percent of poverty for Medicaid, the ACA introduced marketplaces offering subsidized coverage to people with incomes above 100 percent of poverty. This structure means that those in nonexpansion states with incomes above their state’s Medicaid eligibility threshold but below 100 percent of poverty are not eligible for any subsidized coverage. According to prepandemic estimates, about 2.2 million Americans fall into this Medicaid coverage gap, the majority of whom are people of color and people living in the South. 4
Research has overwhelmingly established that Medicaid expansion increased health care coverage, access, and utilization among low-income Americans. 5 Evidence on health outcomes is sparser, reflecting the complex relationship between health insurance coverage and health outcomes. 6 However, a recent study found that the ACA Medicaid expansions reduced disease-related mortality among older adults. 7
Few studies have assessed the impacts of nonexpansion on the millions of low-income Americans who fall into the Medicaid coverage gap, and what evidence exists is often dated and state-specific. A study in North Carolina found that people in the Medicaid coverage gap are less likely to have a regular source of care, less likely to have had a routine checkup in the past year, more likely to forgo a doctor’s visit and skip medication because of cost concerns, and more likely to have multiple chronic conditions or live with a disability. 8 Zhang and Wu found similar results in Texas, and Han et al. found that chronic condition patients were less likely to adhere to prescription medication if they fell into the Medicaid coverage gap. 9
In this study, we look across states to see how the Medicaid coverage gap population was faring immediately before the COVID-19 pandemic. We use the Behavioral Risk Factor Surveillance System (BRFSS) to compare outcomes for the potential Medicaid coverage gap population — those with incomes between their states’ pre-ACA eligibility level for their population group and 100 percent of poverty — in nonexpansion states and comparable expansion states (for details, see “How We Conducted This Study”). We studied the experience of parents and nonparents separately, as these two groups differ in average age and health. Our analyses controlled for sex, race, age, education, employment status, and whether the respondent owns their home; included state and year fixed effects; and clustered standard errors at the state level.
The most direct effect of Medicaid expansion was to substantially increase health insurance coverage rates for the potential gap population. In expansion states, insurance coverage rates among parents increased by 15.3 percentage points and rates among nonparents increased by 10.5 points (Exhibit 2). These improvements in coverage led to reductions in the rate at which financial considerations impeded access to care.
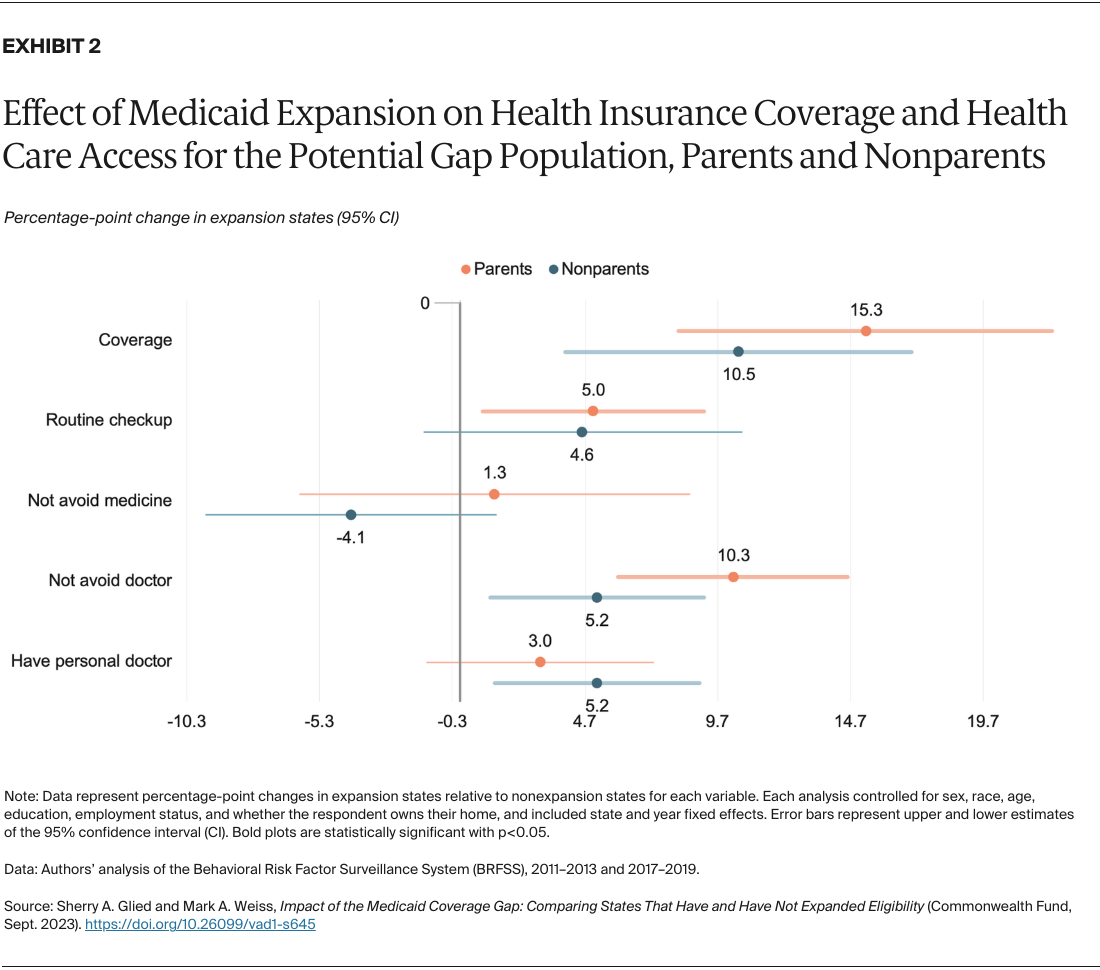
In expansion states, parents in the potential coverage gap reported a 10.3 percent decrease in avoiding doctor visits because of cost, and nonparents reported a 5.2 percent decrease (questions recoded to positive). Both parents and nonparents in the potential gap population saw lower rates of avoiding doctors’ visits after Medicaid expansion. These improvements were one-third and two-thirds as high as the corresponding increase in coverage, suggesting that most people in both groups who gained coverage had experienced problems accessing care before the expansion.
Reduced financial barriers also led to improved connections to care. Parents were 5.0 percentage points more likely to report a routine checkup in expansion states and nonparents were about 5.2 points more likely to report having a personal doctor. These effects, as would be expected, are smaller than the size of the coverage effect, as uninsured people did use some care prior to expansion and the ACA had relatively little impact on the sites where patients received care. 10
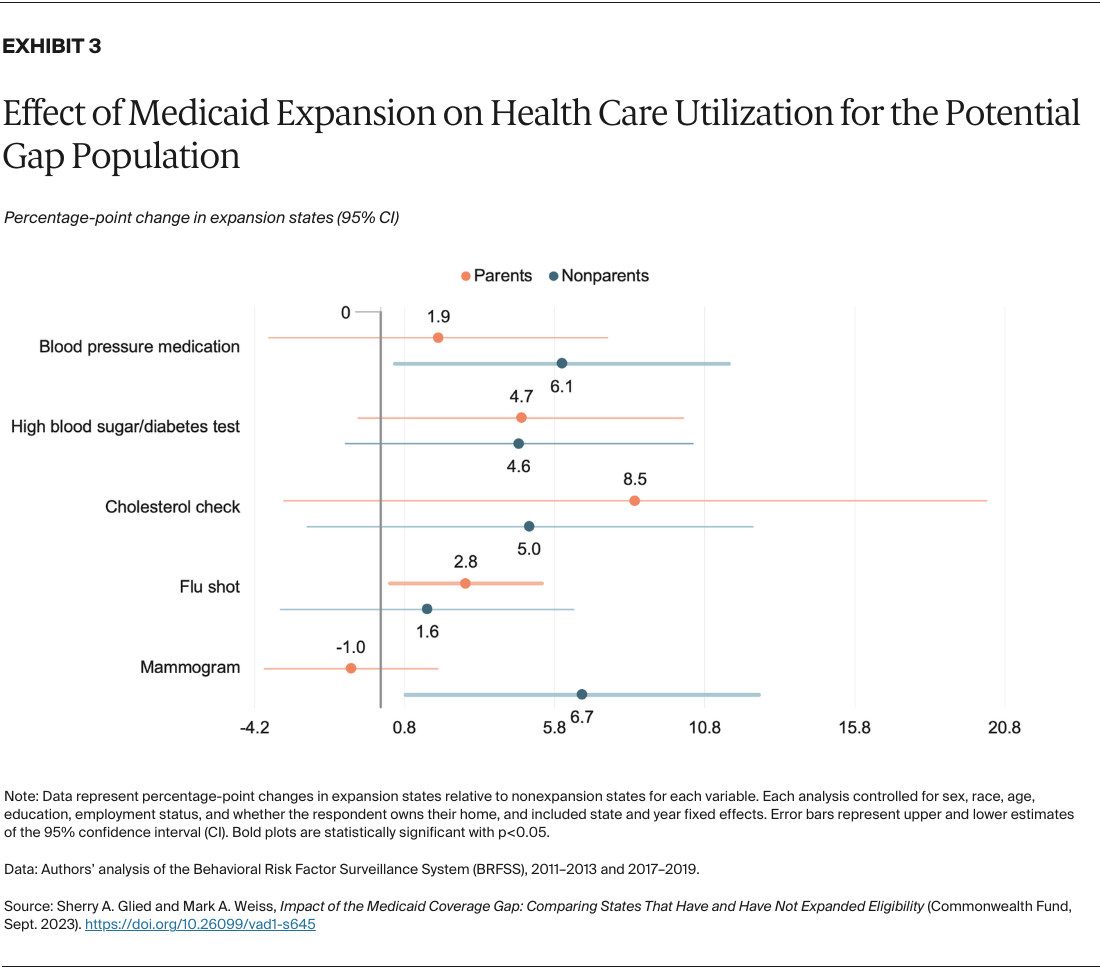
States that expanded access to Medicaid saw increased use of preventive health services among people in the potential gap population (Exhibit 3). Parents were 2.8 percentage points more likely to have had a flu shot and nonparents were 6.7 points more likely to have had a mammogram. Among nonparents in the potential gap who were diagnosed with high blood pressure, those in expansion states were 1.9 points more likely to take medication to treat their condition. As many preventive services are only recommended for specific populations, and not all services are recommended annually, the effects of expansion on preventive service use are smaller than the effects on coverage.
To consider the effects of Medicaid expansion in depth, we contrasted two pairs of states, each with one that did and did not undertake expansion:
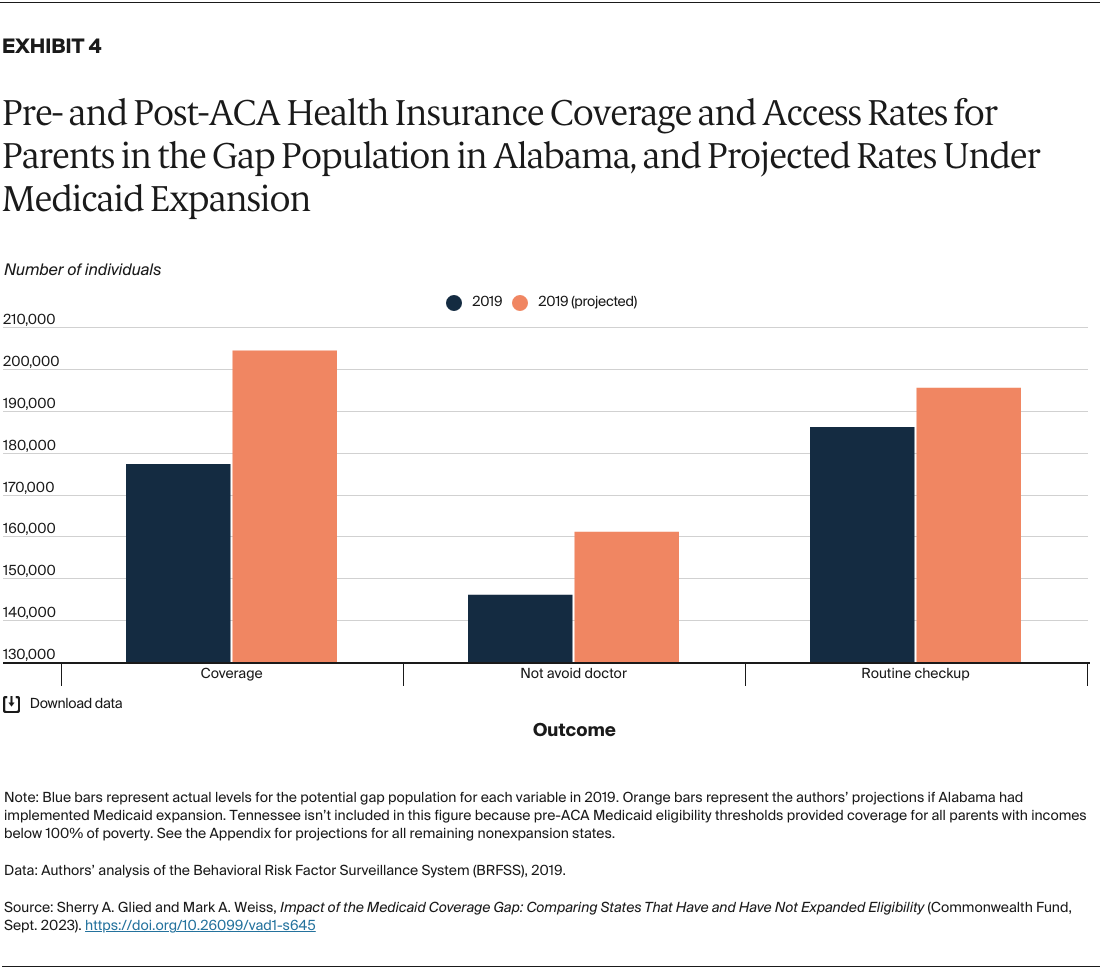
From 2011 to 2013, prior to full implementation of the ACA, average insurance coverage levels in the potential gap populations in Alabama and Arkansas were somewhat similar, as were the rates at which residents of each state reported receiving routine checkups and not avoiding the doctor because of cost. But outcomes for the potential gap population across these two states diverged after Arkansas chose to adopt coverage expansions. While coverage rates improved in both states, in part because of greater awareness of the availability of Medicaid among those who might already have been eligible for coverage, Alabama’s post-ACA coverage levels increased by smaller amounts relative to Arkansas. Coverage in Alabama grew from 52 percent to 65 percent for parents, and from 60 percent to 68 percent for nonparents. Arkansas, on the other hand, saw coverage jump from 38 percent to 79 percent for parents, and from 51 percent to 83 percent for nonparents. 11
Had Alabama expanded Medicaid, over 27,100 more parents and over 15,500 more nonparents in the potential gap would have had health insurance coverage in 2019. Some 9,300 potential gap parents and 6,750 potential gap nonparents would have received routine checkups, and over 15,000 parents and 6,800 nonparents in the potential gap would have seen a doctor rather than avoiding a visit because of cost concerns (Exhibit 4, Exhibit 5, and the Appendix).
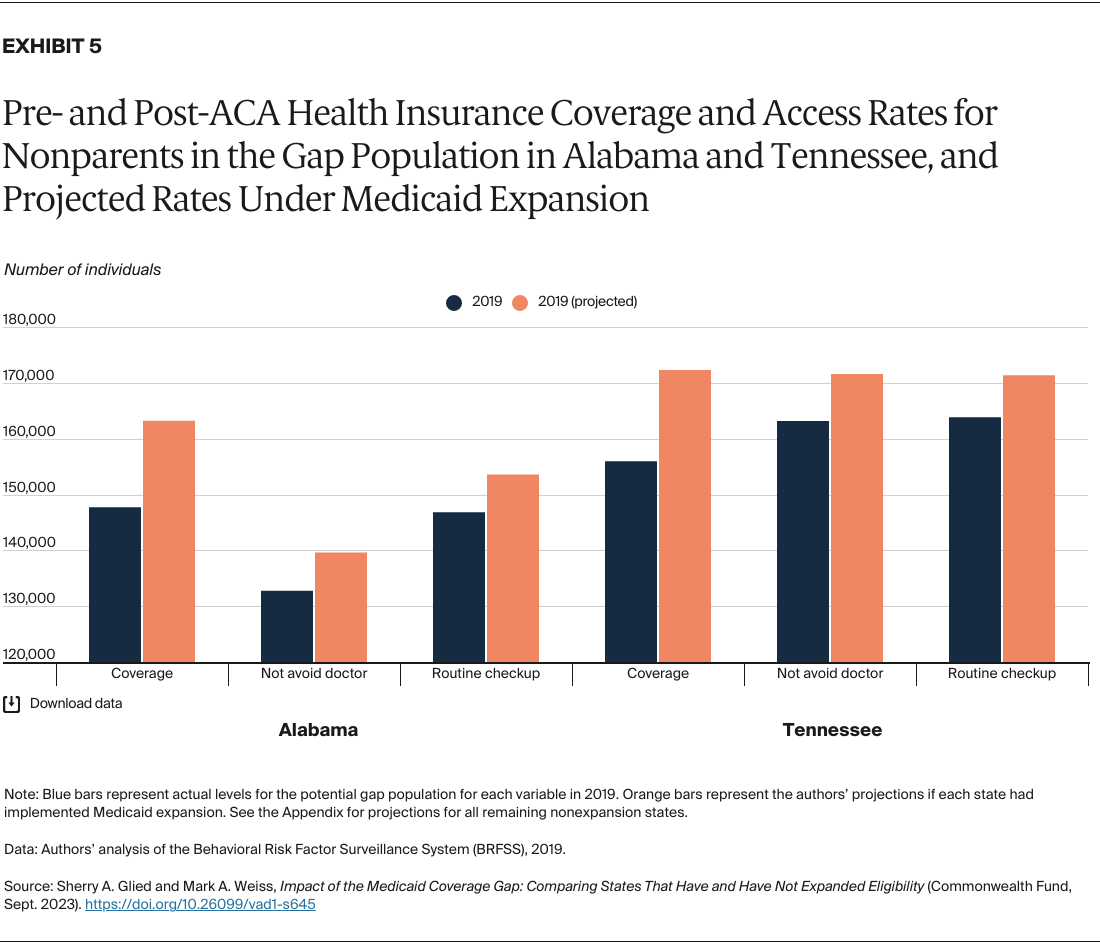
Tennessee and Illinois had Medicaid income eligibility limits for parents greater than 100 percent of poverty prior to the ACA, so the potential gap population in these states consisted entirely of nonparents. After expansion, coverage rates in this potential gap population increased by 32 percentage points in Illinois (from 45% to 77%), significantly more than Tennessee’s 11-point increase (from 52% to 63%). The same is true for rates of seeking medical care that would otherwise have been avoided because of cost concerns: Illinois jumped from 52 percent pre-ACA to 76 percent post-ACA, whereas Tennessee nonparents experienced a comparatively modest increase, from 54 percent to 69 percent.
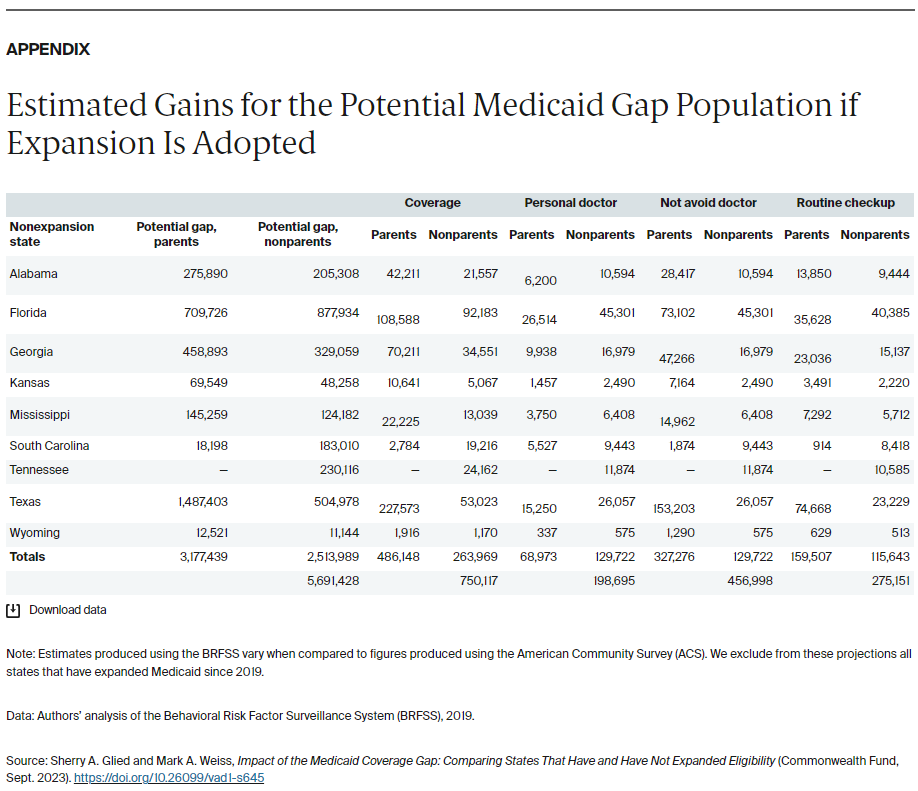
If Tennessee had expanded Medicaid coverage, we estimate that more than 16,300 additional residents would have received health insurance coverage, nearly 8,000 would have had access to a personal doctor, 8,420 would have sought medical care that they avoided because of cost, and 7,500 would have had a routine checkup in 2019. (See the Appendix for estimates on potential gains for the other nonexpansion states.)
Medicaid expansion substantially improved insurance coverage and access to care in the potential gap population. Those in the Medicaid gap in nonexpansion states have fallen substantially behind their counterparts in coverage, financial protection, and preventive screening.
Despite its many benefits, some states have been reticent to adopt Medicaid expansion. 12 Several pathways exist for these states to implement Medicaid expansion, even if state governments are reluctant to do so. Ballot initiatives have brought expansion to several conservative-leaning states, including Idaho, Missouri, Nebraska, South Dakota, and Utah. 13 Several states also have expanded through Section 1115 waivers, making the program more appealing by allowing lawmakers to experiment with certain implementation specifics. And despite the strong partisan divide over opinions about the ACA, some states have managed to tailor the program to appease members of both parties. For example, Democrats in North Carolina were able to garner Republican support for expansion by loosening certificate of need laws. In 2023, North Carolina became the 40th state to expand Medicaid. 14
Whatever the mechanism, passing and implementing Medicaid expansion in the remaining nonexpansion states would help ensure that more people have access to necessary health insurance coverage and health care services.
Data on income, coverage, health care utilization, health outcomes, and demographics are drawn from the 2011–2019 Behavioral Risk Factor Surveillance System (BRFSS) survey. We selected 2011–2013 as our pre-ACA period and 2017–2019 as our post-ACA period. The BRFSS is a telephone survey administered jointly by the federal and state governments, and in each year of available data, some observations come from respondents whose interviews were conducted outside of the year in question. For example, just under 5 percent of the interviews included in the 2019 core survey concluded in 2020. We recoded any such observations to match the year in which the rest of the data appear.
Data on pre-ACA Medicaid eligibility limits come from the Henry J. Kaiser Family Foundation State Health Facts tables. Our sample consisted of 32 states. We first identified all states that had not expanded Medicaid by January 2019: Alabama, Florida, Georgia, Idaho, Kansas, Maine, Mississippi, Missouri, Nebraska, North Carolina, Oklahoma, South Carolina, South Dakota, Tennessee, Texas, Utah, and Wyoming. 15 We then paired each nonexpansion state with expansion states that were geographically proximate, had similar pre-ACA Medicaid income eligibility limits, and had similar pre-ACA uninsurance rates of parents and nonparents in the potential Medicaid coverage gap. Pair states included Arkansas, California, Illinois, Indiana, Iowa, Kentucky, Louisiana, Minnesota, Montana, Nevada, Oregon, Pennsylvania, Rhode Island, and Washington.
We restricted our sample to the potential Medicaid coverage gap individuals, those with incomes less than 100 percent of poverty but above the Medicaid eligibility limit for their population in their state. Some adults without dependent children may qualify for Medicaid if they live with a disability. Because the BRFSS lacks sufficient data on whether a respondent has a disability or receives supplemental security income (SSI), we cannot distinguish this population and include this group among all nonparents.
Determining whether respondents fell into the potential gap population was complicated by two limitations in the data: first, prior to 2014, the BRFSS survey did not include information about the number of adults in the households of cell phone respondents. Previous research has found that in the 2013 survey, mobile respondents were statistically similar to landline respondents. 16 However, removing cell phone respondents from the 2011–2013 data dramatically changed the descriptive statistics of our sample. To account for missing data, we followed Lyu and Wehby and made two assumptions about respondents’ household size for observations prior to 2014: that married respondents and respondents in unmarried couples have one adult in the household, and that unmarried respondents have one adult in the household. 17 We also implemented this assumption in state-year combinations that lacked sufficient data on household size, including Florida, Georgia, Minnesota, and Wyoming in 2017.
Second, the BRFSS does not contain continuous household income estimates, and instead reports whether each respondent’s income falls into a certain bracket. We adopted Hest’s strategy of assigning to each respondent a household income equal to the median of the bracket in which they reported their annual earnings, e.g., a respondent who reported making $10,000–14,999 was assigned a total household income of $12,500. 18 Because the BRFSS lacks precise reports of respondents’ income, we are unable to tell if our estimates accurately reflect the number of adults in the potential coverage gap. Assigning to each respondent an income equal to the lower bound of the bracket in which they reported their income, for example, would lead to a greater proportion of the sample being classified as the potential gap population, whereas using the upper bound would have the opposite effect. The uncertainty is compounded by the BRFSS’ use of an “omnibus” measure of income, which asks for total household income rather than aggregating individual family members’ income. Previous research has cautioned that omnibus income measures in health surveys may overstate the number of adults living in poverty. 19
We implemented a pre/post analysis among parents and nonparents in the potential gap population among all 32 sample states, where the coefficient of interest was the interaction term between expansion and the posttreatment time period. We controlled for sex, race, age, education, employment status, and whether the respondent owns their home, included state and year fixed effects, and clustered standard errors at the state level.
To estimate the number of nonexpansion residents who would have benefited from expansion (see the Appendix), we multiplied the coefficients from our primary analysis by the total number of potential gap parents and nonparents in each remaining nonexpansion state in 2019. It is possible that our estimates overstate or understate potential changes in health insurance levels, given that populations and policies vary widely state-by-state.